SeriesLine (deprecated)
⚠️ Deprecated since 0.23.0: Use SeriesLines instead.
Define the style properties for a line series in a chart.
This archetype only provides styling information and should be logged as static
when possible. The underlying data needs to be logged to the same entity-path using
archetypes.Scalars.
Components components
Optional: Color, StrokeWidth, Name, SeriesVisible, AggregationPolicy
Shown in shown-in
API reference links api-reference-links
Example example
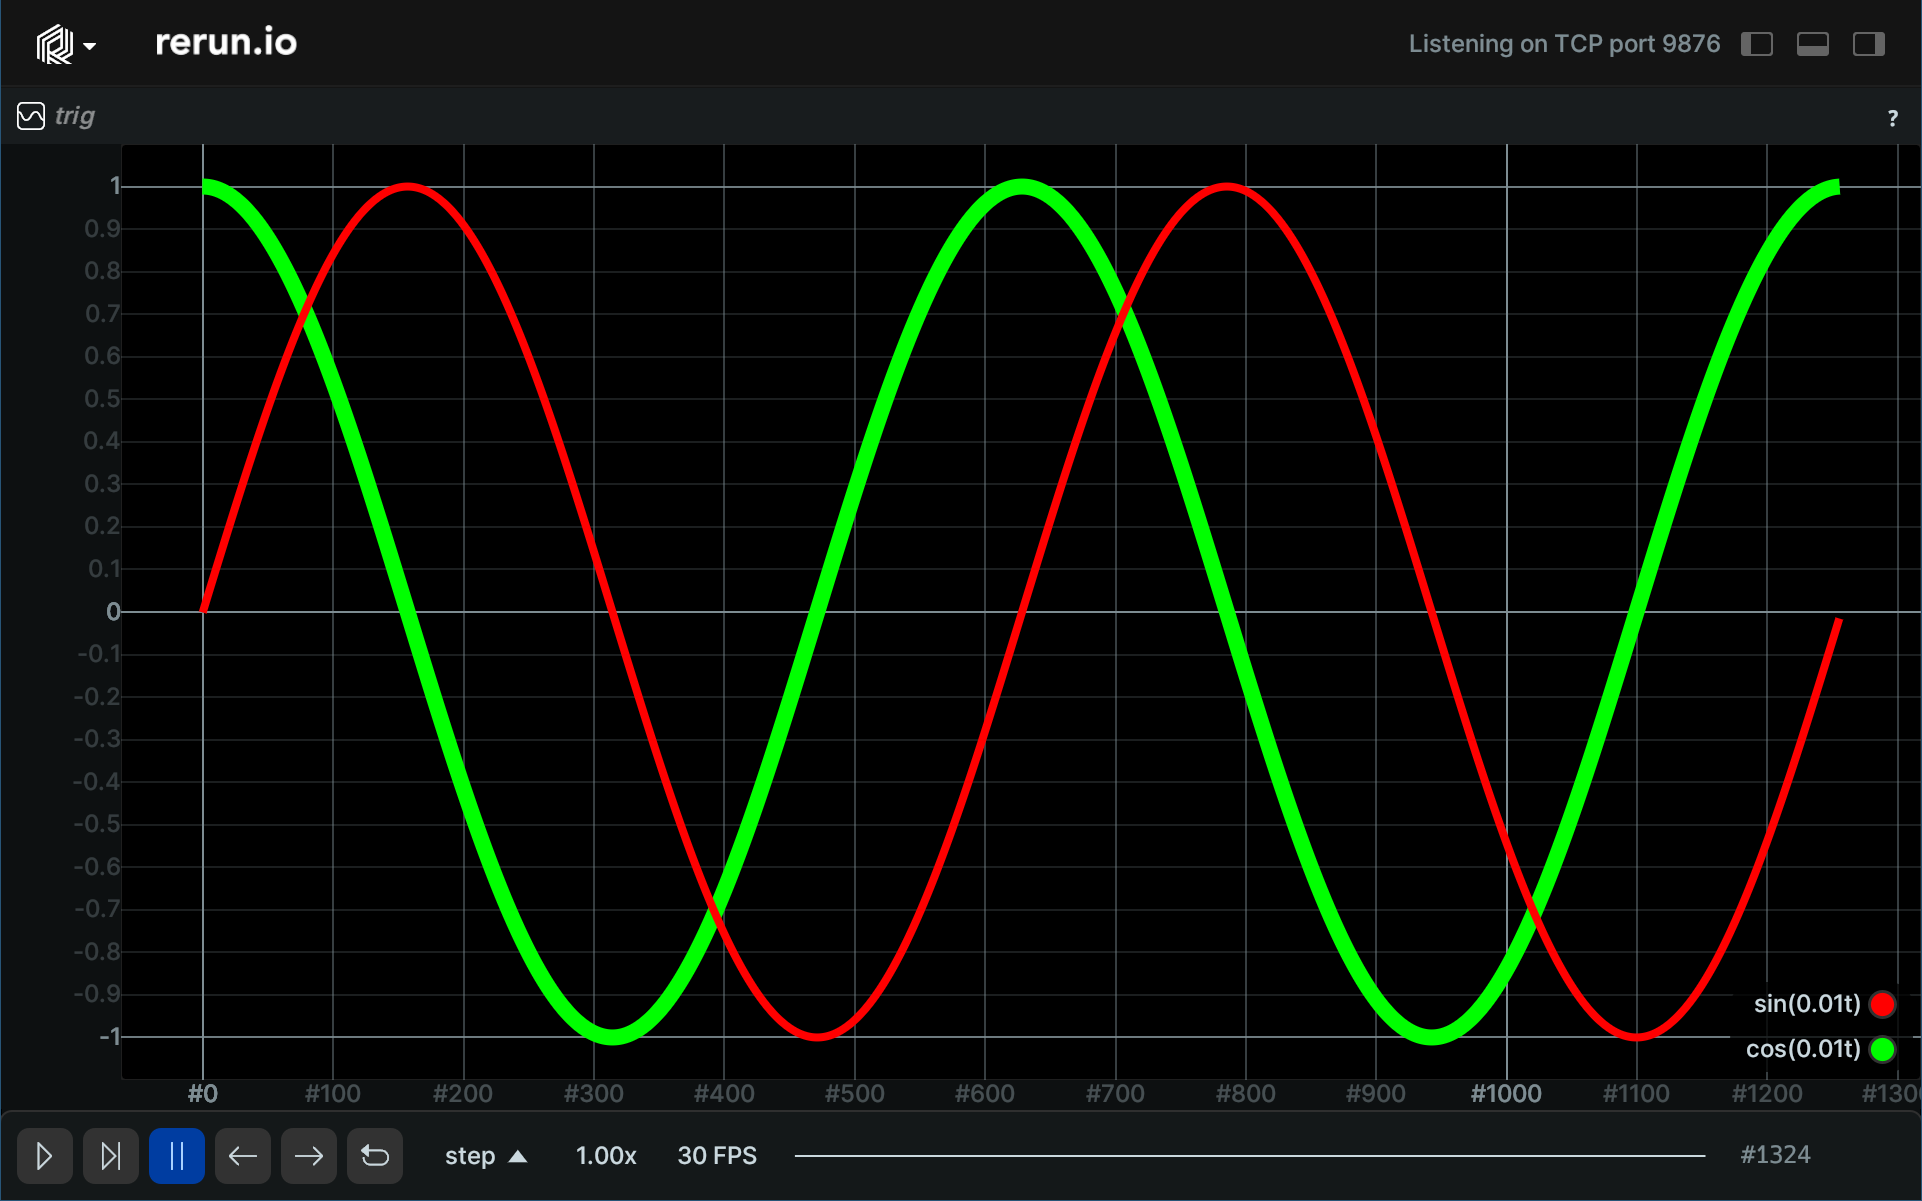
Line series line-series
"""Log a scalar over time."""

from math import cos, sin, tau

import rerun as rr

rr.init("rerun_example_series_line_style", spawn=True)

# Set up plot styling:
# They are logged as static as they don't change over time and apply to all timelines.
# Log two lines series under a shared root so that they show in the same plot by default.
rr.log("trig/sin", rr.SeriesLines(colors=[255, 0, 0], names="sin(0.01t)", widths=2), static=True)
rr.log("trig/cos", rr.SeriesLines(colors=[0, 255, 0], names="cos(0.01t)", widths=4), static=True)

# Log the data on a timeline called "step".
for t in range(int(tau * 2 * 100.0)):
    rr.set_time("step", sequence=t)

    rr.log("trig/sin", rr.Scalars(sin(float(t) / 100.0)))
    rr.log("trig/cos", rr.Scalars(cos(float(t) / 100.0)))